As marketers, we find ourselves tracking and reviewing metrics on a daily basis. We’re well acclimated with sifting through our favorite reporting tools and pulling out the notable numbers that impact our client’s KPIs (key performance indicators) to confidently present to them. However, if you’re not in-and-out of these analytic tools on a regular basis and unfamiliar with the lingo, it can be confusing to understand what metrics you should keep an eye on and which of those defines success. So, think of this blog as a guide to the stuff that matters when you’re looking at your reports and business performance metrics. While the tools we use may be different, the terminology that we see remains the same. Some of our favorite reporting tools include: Google Analytics, Semrush, Google Search Console, and Hubspot - just to name a few. Let’s jump in together to unpack some of the most common pieces of data with the language you may run into.
Top-Level Performance Metrics You Should Know

The following performance metrics are probably some of the most common of those that you’ll typically encounter in any given report.
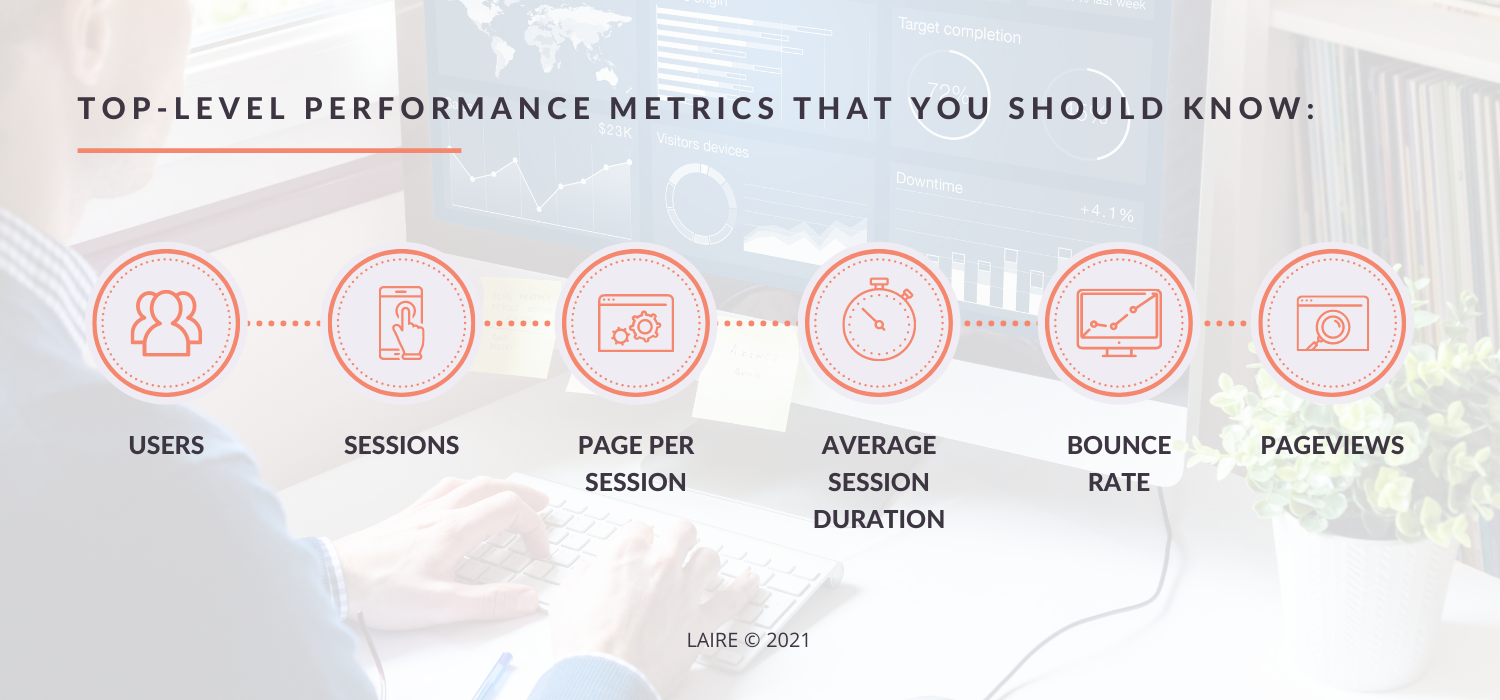
- Users - Users are defined as visitors who have landed on your website and initiated a session. At the exact moment that this individual lands on any single page of your website, they are then identified as a new or returning user.
- Sessions - A session is a group of user interactions to your website that take place within any given time period. The session is the period of time that a user is active on your site.
- Page Per Session - Page per session is calculated by dividing the total number of page views by the total number of sessions. The number you get is the average number of pages that a user views during any given session.
- Average Session Duration - Average session duration tells you how long users are spending on your website. Just like the name says, it’s the average length of time of a single session, calculated by totaling the duration of each session in a given date range and dividing it by the entire number of sessions.
- Bounce Rate - Bounce rate comes into play when your users viewed only a single page and left your website without interacting with anything further. It is the percentage of sessions with a single pageview. A higher bounce rate is often an indication that users are leaving your site (or whatever page they landed on) because they didn’t find what they were looking for. We’re often asked, “what’s a good bounce rate?”, and while there are many factors that play into understanding this percentage, we can generally say that you should aim for a bounce rate of under 40%. A bounce rate between 40% and 55% is usually okay, but anything higher indicates that it’s time to assess your content.
- Pageviews - A pageview is when any page has been viewed by a website user. It’s often helpful to organize your website pages or blog pages by pageview, to determine which content is most popular with your visitors.
Marketing Analytics to Impress Your Team With
These analytics may be less frequently seen, but they are of no less value when it comes to measuring success. Understanding these terms will allow you to dig a bit deeper into your metrics. And hey, they may even help you impress the boss…
- Click-Through Rate - Click-through rate or CTR is important to help you understand the percentage of users who take action and click on a specific link versus those who simply view the link on any page, email, ad, offer, CTA, etc. It’s great when a user is viewing your content, but for them to actually engage with and click on the piece is when things get really exciting.
- Conversion Rate - Piggy-backing off of CTR above, conversion rate is a number that tells us that our marketing efforts are actually getting people to do what we want them to do. In a marketer’s world, the word ‘conversion’ is music to our ears. Your conversion rate is the percentage of users that visit your website and convert (i.e., do what you want them to do). A conversion looks different from business to business, but a few common types of conversions can include: submitting a form, signing up for a subscription, downloading an offer, engaging with your online chat, making a purchase, etc.
- Total Clicks - There’s no tricking you with this one. Total clicks refers to the total number of clicks recorded on your website’s URLs.
- Total Impressions - An impression is defined as a link URL that appears in a search result for a user. Don’t let this one confuse you. It’s the number of times that a user loads a page where your site ranks in any position on their search. If your website has appeared in the search engine results pages (or SERPs) for any given user, this counts as an impression.
- Average Position - Every search results page in Google contains 10 results before you click to the next page. Average position tells you the ranking of your website URLs for the searched query or queries. For example, if someone typed in one query and found your site as the 12th result, and for another query you were found in the 4th spot, your average position would be 8. ((12+4)/2)
Unpacking Common Acquisition Sources
Traffic acquisition sources categorize the origin through which a user found your site. Every single session or visit to your site has an originating source. We’ve outlined the most frequently seen channels below.
- Direct Traffic - Direct traffic is the number of people who typed your website’s URL directly into their browser to find you. It’s also likely that they have your site bookmarked on their browser for ease. Direct traffic is made up of repeat or returning users to your site.
- Organic Search - This is a biggie! As inbound marketers, organic search is the number we seek to impact the most through various content marketing efforts. These users are those who found your website after using a search engine because you had the right content and keywords in place to answer their query. We say these users found you ‘organically’.
- Social Media - This traffic source counts all of the users who come to your website after first visiting a social platform. There are reports that can drill down the exact social media network that was the origin for the user - and even what post they interacted with to find you - but this number will give you the total of users who found you in this way, regardless of network.
- Referral - A referral is reported when a user comes to your website by clicking through from another third-party website link. When other websites are sending you traffic from their own site, we call these users referrals.
- Paid Media - If you have AdWords or other paid advertising campaigns in place, this number lets you know how many users your efforts are generating to your website.
Social Media Metrics to Better Understand Your Audience

The following metrics are specifically for your social media performance. You may see some overlap in the names from items we’ve already discussed previously in this blog, but hang with us. It’s important to analyze your performance on social media in a similar way as you would when you are diving into website metrics. Social media metrics can be broken down into a couple of categories: activity metrics, reach metrics, engagement metrics, acquisition metrics, conversion metrics, and retention metrics. We’ll highlight a few of our favorites below.
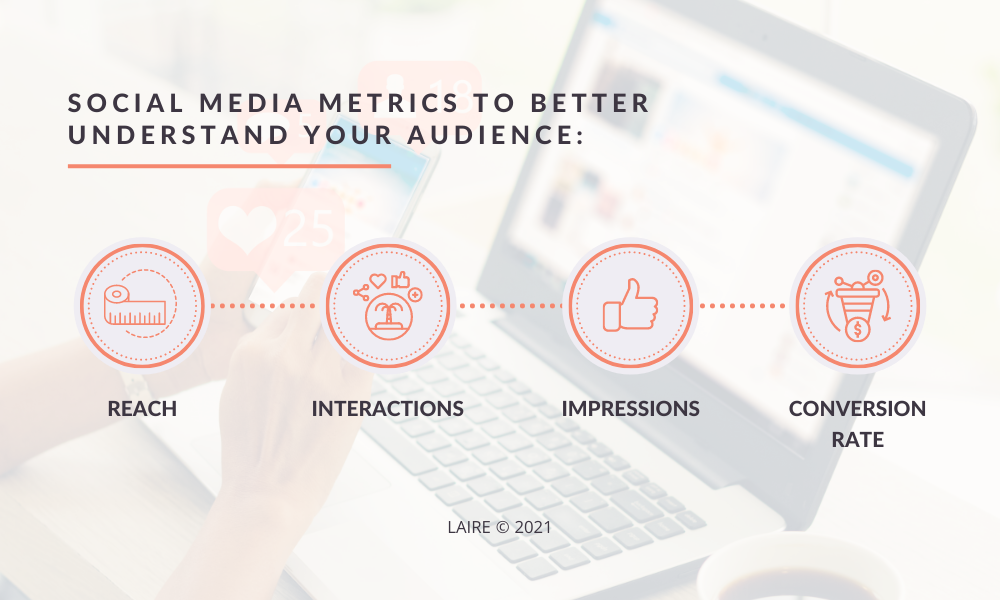
- Reach - Reach measures the size of the audience that you are communicating with. This number is the total number of individuals that you have the potential to influence through your efforts on social.
- Interactions - Interactions can include several engagement metrics, such as: likes, shares, brand mentions, and comments on a post. To see how people are participating with your brand online and starting conversations with you, take a deeper dive here.
- Impressions - Impressions tells us how many people saw your post in their social media feed. We like to see a higher number of impressions when we’re trying to maximize brand awareness efforts.
- Conversion Rate - If you’re sharing content that has a call-to-action link of some sort, you’ll want to measure the conversion rate to determine the users who do decide to take action and convert on your post. A higher conversion rate tells you that your content is valuable, relevant, and compelling to your target audience. In other words, you nailed it.
Wrapping it Up
If you have a good tool in place (or a great marketing agency, cough cough), pulling analytics like these can be a breeze. What really counts is knowing how to interpret that data and then what you need to do about it to impact your business. We hope that you feel empowered to do exactly that! Each of the metrics we’ve outlined in this reference blog can provide really powerful insights into exactly who your audience is, what type of content they like to see, when and how they like to see it, and ultimately, what it takes for them to convert.
If you’re curious about industry benchmarks you should be paying close attention to, give us a shout. In the meantime, grab a copy of our 25 Website Must-Haves to learn how to drive more traffic, leads, and ultimately, sales.


